Add a custom dashboard and specify the API data source
Related information
- Go to Analytics.
- Ensure that the Project Financials option is selected from the Select Category dropdown.
- Select the Custom tab.
- Select Add Custom Dashboard.
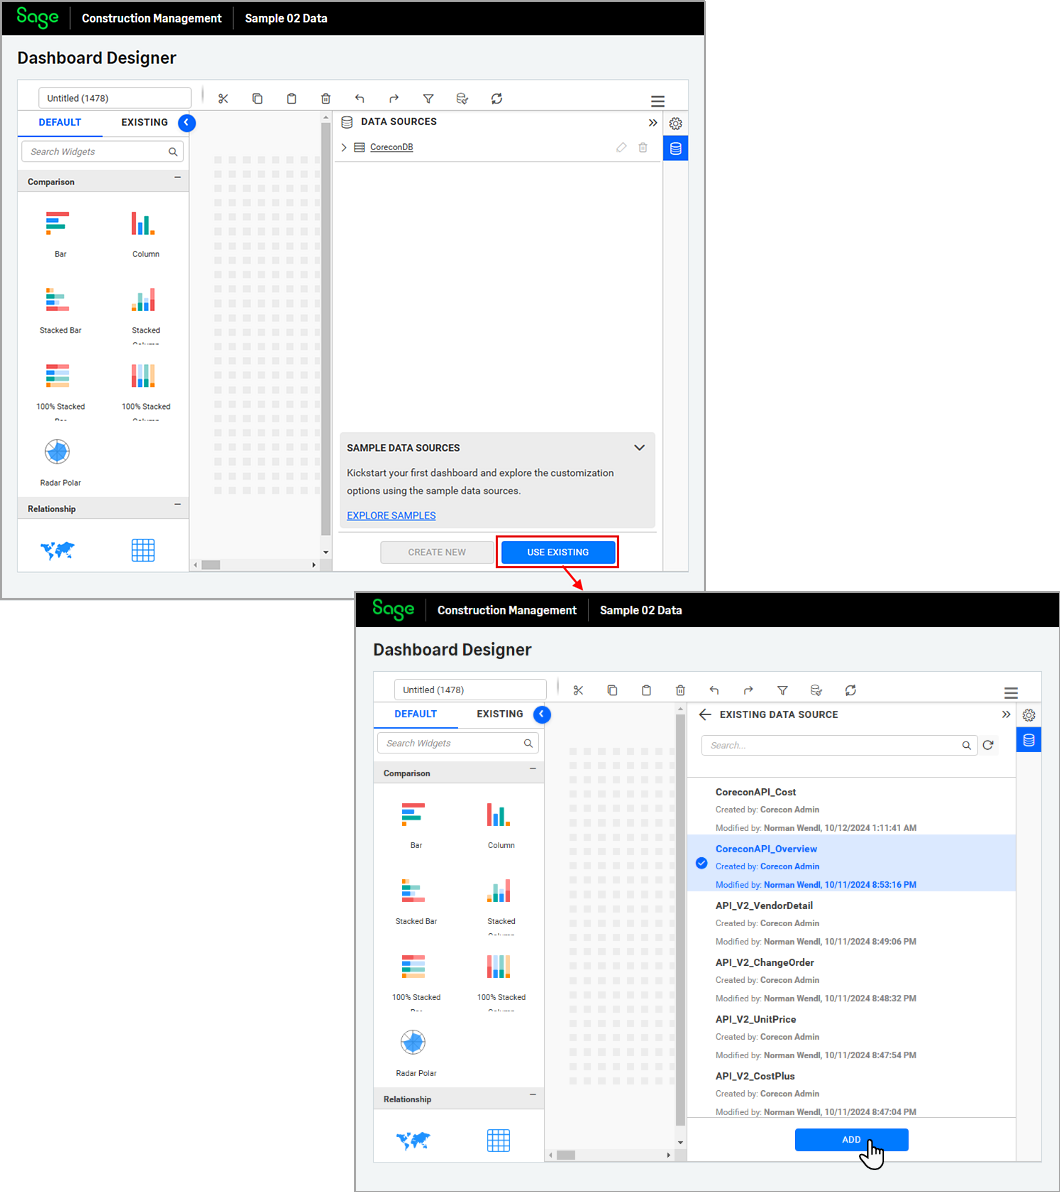
- In the Dashboard Designer, select the Data Sources icon (
 ) on the right-hand side to select the appropriate API.
 - Select USE EXISTING.
- Optionally, use the Search field to filter the list.
- Select the API from the list and select ADD.
For the majority of dashboards, only one additional API data source is needed.
The dashboard default canvas size is 48 columns x 24 rows, which dynamically adjusts based on the user's screen size. You can add more rows
using the plus icon at the bottom of the page.
The newly added API Data Source appears under the DATA SOURCES section on the right-hand side.
The Sage Construction Management DB data source, which displays under the DATA SOURCES section by default, is included in all standard and custom dashboards, and cannot be deleted.
Next step: Configure the default font size for dashboard widgets and export options.