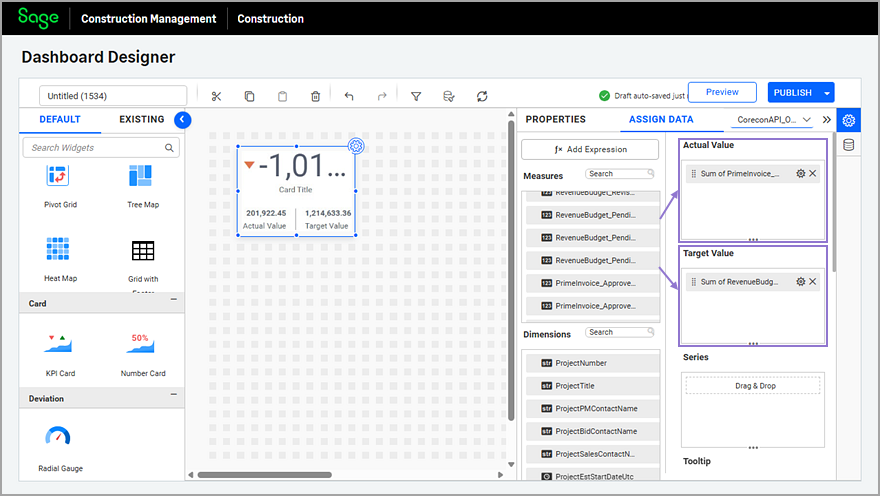
Add the KPI Card widget to the dashboard
- Drag and drop the KPI Card widget into the design panel.
- Select the properties icon (
 ) in the top-right corner of the widget.
 - Select the ASSIGN DATA tab and select the API data source that you manually added to the dashboard from the dropdown.
- Drag and drop one of the measures listed in the Measures section to the widget's Actual Value field.
For example, the PrimeInvoice_Approved_Total.
Add the Actual Value measure before adding the Target Value measure. - Drag and drop one of the measures listed in the Measures section to the widget's Target Value field.
For example, the RevenueBudget_Revised_Total.
- Optionally, select the cog icon (
 ) next to the measure to change the math function and the number format.
For example, you can change it from Sum to Avg.
Sum is the most common math function used in dashboards. - Select the PROPERTIES tab and rename the widget, adjust the font size, and configure the attributes as follows:
- Review the selected Type in the KPI Value section and adjust the KPIFontSize as needed.
- Review the selected Type in the Left Value and Right Value sections and modify the following fields as needed:
- Value Font Size
- Caption text
- Caption Font Size
- Deselect the Title Auto Font Size and Subtitle Auto Font Size options in the Container Appearance section, and adjust the Font Size for each.
- Modify the rest of the attributes as needed.
- Adjust the width and height of the KPI Card widget as needed.The 48x24 dashboard canvas adjusts to the user's page size, so you might need to re-adjust the widget's dimensions after previewing.